Đăng ký bộ dự đoán đề thi IELTS, Sách/Tài liệu/Khóa học IELTS: LINK
Jenny đã hướng dẫn cách viết 1 bài IELTS Writing Task 1 line graph band 7. Bài viết này Jenny hướng dẫn cách ví dụ liên quan đến IELTS Writing Pie Chart (band 8.0) – Cách paraphrase trong IELTS Writing Task 1. Nếu thấy bài viết hữu ích, đừng quên chia sẻ cho các bạn thí sinh khác để lấy may mắn trước khi thi nhé. Good luck!
Xem thêm >> bộ dự đoán IELTS Speaking part 1, bộ dự đoán IELTS Speaking part 2 3, bộ dự đoán IELTS Writing task 2
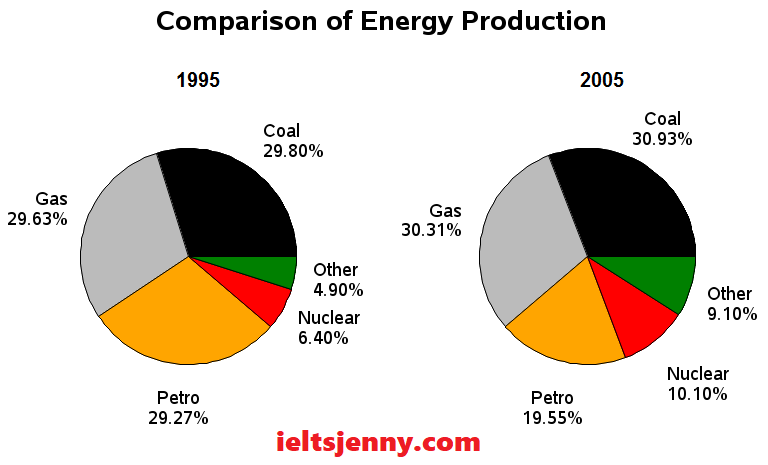
Xét ví dụ dưới đây: The graphs below show the comparison of different kinds of energy production of France in two years.

Cấu trúc bài IELTS Writing task 1
- 1 câu mở bài (paraphrase đề thi)
- 2 câu overall (2 điểm nổi bật nhất trong biểu đồ)
- Body 1: 2-3 câu thân bài 1
- Body 2: 2-3 câu thân bài 2
Hướng dẫn cách viết bài viết hoàn chỉnh cho đề bài trên
1 câu mở bài (paraphrase đề thi)
- Đề thi: The graphs below show the comparison of different kinds of energy productionof Francein two years.
- The graphs = The two pie charts
- the comparison of = the proportion of
- show= compare / indicate / illustrate
- different kinds of energy production = five types of energy production
- of France = in France
- in two years = in 1995 and 2005
Note: Chú ý màu sắc tương ứng trên đề thi với cách paraphrase bên dưới.
- Câu paraphrase hoàn chỉnh:
The two pie charts illustrate the proportion of five types of energy production in France in 1995 and 2005.
2 câu overall (2 điểm nổi bật nhất trong biểu đồ)
- Tips: Đối với Pie Chart, chú ý xem tỷ lệ của cái gì chiếm nhiều nhất, ít nhất trong suốt thời gian. Sự dịch chuyển thay đổi nổi bật giữa các năm mạnh hay không đáng kể.
- Phân tích trong bài này:
- gas và coal chiếm phần lớn trên 1/2 toàn bộ, trong khi nuclear vad other kinds thì chiếm tỉ lệ nhỏ nhất. (1)
- Sự dịch chuyển thay đổi phần trăm trong 10 năm của các loại năng lượng đều khá nhỏ (2)
- Viết lại 2 điểm nổi bật bên trên bằng tiếng anh:
- (1) The most significant sources of energy were gas and coal, which together accounted for over half the production of energy, while nuclear and other kinds of energy sources generated the least amount of energy in France.
- (2) There was only minimal change over the 10 year period.
- Overall hoàn chỉnh:
Overall, it is clear that in both years, the most significant sources of energy were gas and coal, which together accounted for over half the production of energy, while nuclear and other kinds of energy sources generated the least amount of energy in France. In all types of energy production, there was only minimal change over the 10 year period.
Body 1 và body 2 chỉ là diễn giải số liệu chi tiết trong vòng 5-6 câu.
- Body 1: Tập trung mô tả về coal và gas thôi
Energy produced by coal comprised of 29.80% in the first year and this showed only a very slight increase of about a mere 1 % to 30.9% in 2005. Likewise, in 1995, gas generated 29.63% which rose marginally to 30.1% 10 years later.
Notes:
+ comprise of (v) = consist of (v)
+ Likewise, …: Tương tự như vậy
+ marginally (adv) = slightly
+ mere (adj) = only
- Body 2: Mô tả vài yếu tố còn lại trong vòng 2-3 câu.
With regards to the remaining methods of producing energy, there was an approximate 5% growth in production from both nuclear power and other sources to 10.10% and 9.10% respectively. Petrol, on the other hand, was the only source of energy which decreased in production from 29.27% in 1995 to around 19.55% in 2005.
+ With regards to …=> Cụm từ ưa thích để bắt đầu 1 paragraph mới.
+ an approximate 5% growth in …: một mức tăng trưởng xấp xỉ 5% về …
+ respectively (adv): tương ứng
+ on the other hand, …: mặt khác
Tổng kết Pie Chart Tips
– Luôn luôn đề cập đến tỉ lệ lớn nhất, nhỏ nhất (Important – Ko được quên) – Always highlight the largest and smallest proportions.
– Nếu như có 2 pie charts trở nên với các khoảng thời gian khác nhau, bạn phải đề cập đến đặc điểm thay đổi chính – If there are two pie charts in different time periods, then you must highlight the key changes / trends.
– Ngoài những động từ thông thường mô tả sự thay đổi các bạn đã biết, sử dụng thêm các từ như account for … / comprise of …. / represent – Use pie chart language – accounts for / comprises of / represents.
– Nếu như biểu đồ không phải là % mà là các cách tính khác thì có thể sử dụng cụm The phrase “Units are measured in …” để mô tả rõ hơn – The phrase “Units are measured in …” should be used when the units have not been stated in the previous sentence.
* * * Như vậy để viết 1 bài IELTS Writing Task 1 band 8 trở lên không khó. Chúc các bạn học tốt!
Xem thêm >> tinh diem ielts, tính điểm ielts, IELTS Writing Task 1 Pie chart
Đăng ký bộ dự đoán đề thi IELTS, Sách/tài liệu IELTS: LINK ĐĂNG KÝ