Đăng ký bộ dự đoán đề thi IELTS, Sách/Tài liệu/Khóa học IELTS: LINK
Bạn đang tìm kiếm nguồn tài liệu hữu ích để tự học IELTS writing task 1 Line Graph tại nhà? Hãy tham khảo ngay một ví dụ mẫu IELTS Writing Task 1 – Line graph – Band 7+ để phân tích đánh giá nhé. Và đừng quên, nếu thấy bài viết hữu ích thì nên chia sẻ cho các bạn thí sinh khác để lấy may mắn trước khi thi nhé. Good luck!
Xem thêm>>
- Unit 1 – Mẹo làm bài thi IELTS Writing
- Unit 2 – Các dạng bài IELTS Writing Task 1 và chiến lược làm bài
- Unit 3 – Cách diễn đạt số liệu xu hướng tăng trong Writing Task 1
- Unit 4 – Cách diễn đạt số liệu xu hướng giảm trong Writing Task 1
- Unit 5 – Cách diễn đạt số liệu sự biến động liên tục trong Writing Task 1
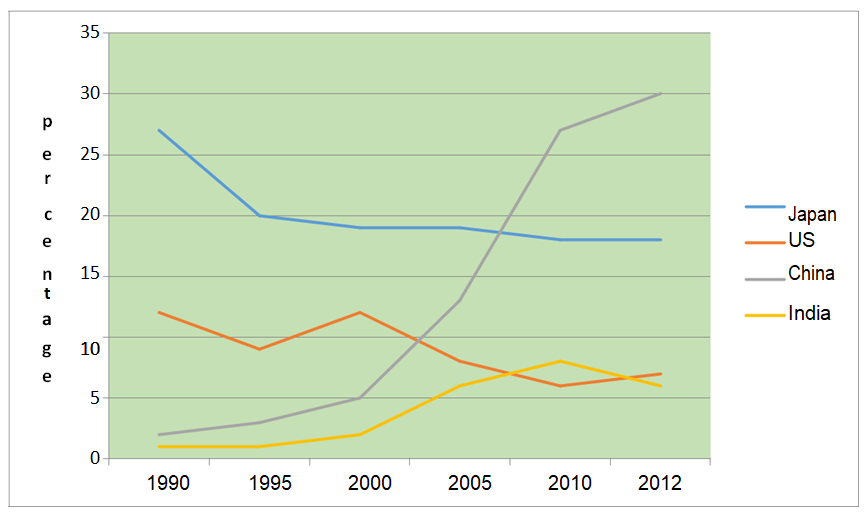
Đề bài: The graph below shows the percentage of Australian exports to 4 countries from 1990 to 2012 (trích từ đề thi thật 18/09/2019)

Lập báo cáo nhanh (Creating a quick report plan):
- Paraphrase paragraph:
- The graph => The line chart;
- shows => compares/illustrates;
- the percentage of => the proportion of / the figure for;
- 4 countries => Japan, the USA, China and India / four different nations (Japan, the USA, China and India)
- Overview/summary paragraph
- (1) before 2005, highest % of exports to Japan
- (2) after 2005, the figures for China overtook those for Japan
- Paragraph 3: report and compare figures for 1990 and 1995
- Paragraph 4: report and compare figures and trends for 2000-2012.
Bài báo cáo IELTS Writing Task 1 hoàn chỉnh (The completed report)
The line chart illustrates the figure for exports from Australia to four different nations (Japan, the USA, China, and India) between 1990 and 2012.
Overall, the data indicate that the highest proportion of Australian exports went to Japan before2005. However, the percentage of exports to China overtook those to Japan after 2005.
First, in 1990, exports to Japan accounted for 27% of the total, more than double the figure for Australian exports to the USA. By contrast, exports to China and India were low, at 2% and 1%, respectively. While the proportion of exports to Japan significantly decreased to 19% and exports to the USA considerably fell to 9% in 1995, the figure for exports to China and India rose slowly.
Second, there was a gradual fall in the percentage of exports to Japan, which stood at 18% in 2012. The US export market fluctuated, but the trend after 1995 was downward, finishing at 7% of total exports at the end of the period. Although exports to India also fluctuated, these increased overall to 6% in 2012. The most significant change, however, was the growth in exports to China, overtaking those to Japan, and reaching a peak of 30% in 2012.
201 words
Học được gì qua bài ví dụ trên:
- Paraphrase lại câu hỏi đề bài:
- Australian exports = exports from Australia
- 4 countries = four different nations (Japan, the USA, China, and India)
- from 1990 to 2012 = between 1990 and 2012
- Overall / Summary:
- Chọn 2 sự kiện tiêu biểu nhất để miêu tả; cao nhất? thấp nhất? hay biến động mạnh nhất?
- Có thể bắt đầu bằng “Overall, the data indicate that… However, …”
- Paragraphs: dùng linh hoạt “account for, decrease increase, rise, fall, start at, fluctuate, reach a peak of…” và các trạng từ “respectively, significantly, considerably, slowly, gradual, …”
Thông tin bổ ích khác: bài mẫu ielts writing chủ đề giáo dục, band điểm ielts, bảng quy đổi điểm ielts trường đại học việt nam
Đăng ký bộ dự đoán đề thi IELTS, Sách/tài liệu IELTS: LINK ĐĂNG KÝ
